How to Use Gold–Silver Ratio (GSR)? Strategic Guide for Investors
This comprehensive, data-driven guide to the Gold–Silver Ratio (GSR) explains what the indicator is, how it is calculated, and how investors can use it to identify market trends, optimize precious metals investments, and develop effective gold and silver trading strategies.
What Is the Gold–Silver Ratio?
The Gold–Silver Ratio (GSR) is a financial metric that measures how many ounces of silver it takes to purchase a single ounce of gold.
For example, if the ratio is 60, it means that one ounce of gold is worth the same as 60 ounces of silver. This metric is useful for professional investors as well as individuals interested in diversifying their investment portfolios.
What the GSR Indicates
In today’s economic environment, marked by inflation and global uncertainty, the GSR can play an important role in risk management.
When the ratio is high, above 80, silver appears undervalued relative to gold, potentially creating a buying opportunity. Conversely, a low ratio, below 50, may indicate that silver is outperforming gold.
For investors, the GSR is the ultimate "value barometer." It tells you which metal is historically "cheap" relative to the other, allowing for strategic portfolio rebalancing.
Why the GSR Collapsed in Early 2026
The first weeks of 2026 saw a "Silver Supercycle" that stunned Wall Street. Several structural factors caused silver to outperform gold:
- The AI Infrastructure Boom: Silver demand for high-speed data centers and AI-driven robotics reached a critical deficit.
- China’s Export Ban: Effective January 1, 2026, China restricted silver exports to protect its domestic solar industry, causing a physical supply squeeze in London and New York vaults.
- The "Paper Game" Fracture: Institutional investors began demanding physical delivery of silver, causing paper-to-physical premiums to skyrocket.
Historical Context
The Gold–Silver Ratio has a long historical record. In ancient Egypt, the ratio was roughly 2.5:1. During the Roman Empire, it rose to around 12:1. In the 19th century, the United States implemented a bimetallic standard with ratios of 15:1 or 16:1.
In modern times, the ratio has experienced greater volatility:
⏲️1915: In 1915, the ratio was approximately 40.
⏲️1980: During the 1980 crisis, it dropped below 20.
⏲️2020 (Pandemic Peak): 125:1 (Silver was historically cheap).
⏲️2025 (Average): 80:1 to 65:1 (Steady silver gain).
⏲️January 2026 (The Squeeze): 45:1 (Silver reached temporary "fair value" or overbought levels).
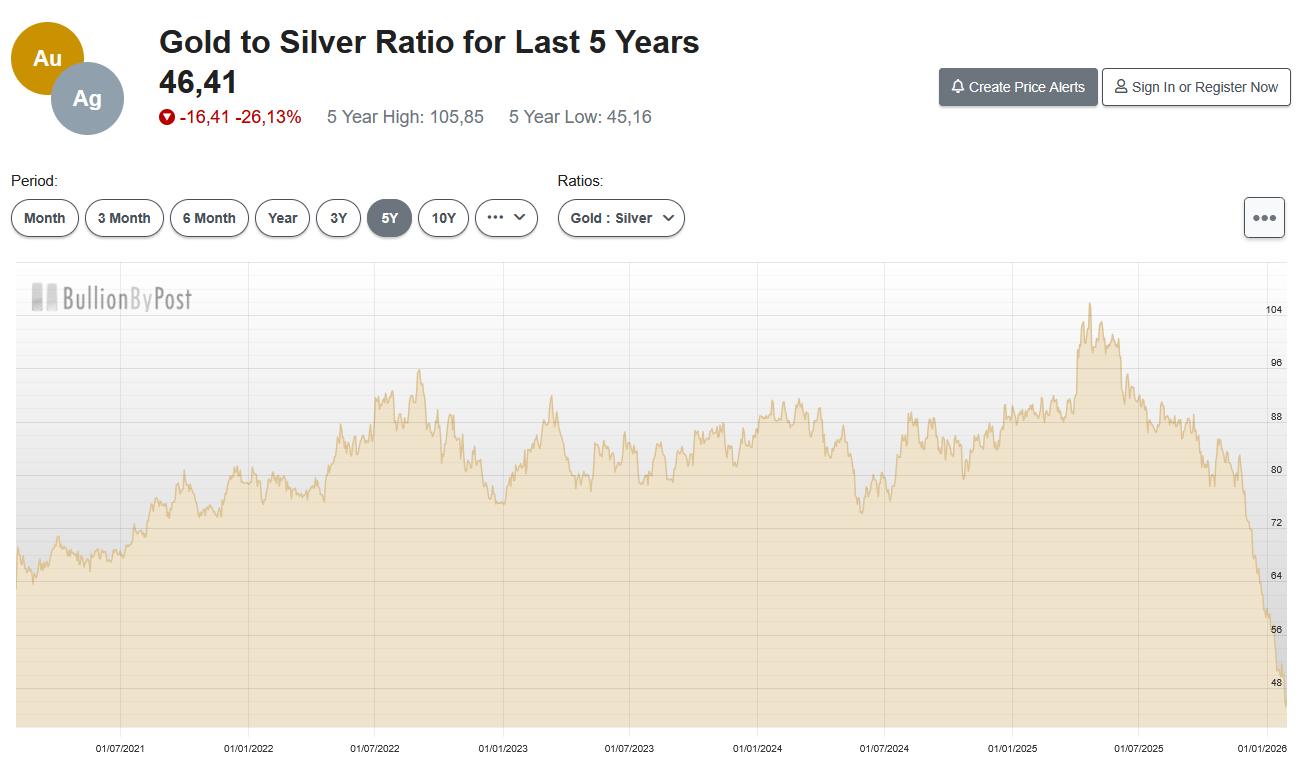
Gold-Silver Ratio Chart
A Gold–Silver Ratio chart is a line graph showing historical changes in the ratio over time. The vertical axis represents the number of silver ounces required to purchase one ounce of gold, while the horizontal axis represents time periods.
This chart typically highlights sharp fluctuations, such as peaks above 100 during crises, when silver becomes relatively cheaper, and lows below 50, when silver tends to outperform gold. It also helps investors identify long-term trends, with the historical average generally ranging between 60 and 70, as well as potential buying and selling opportunities.
Check out the GSR chart over the last 5 years on the image below:
Top GSR Investment Strategies for 2026
Successful metals investors don't just buy and hold, they trade the ratio to increase their total ounces without adding new capital.
1. The 80/50 Rule (The Core Strategy)
When GSR is > 80: Sell Gold, Buy Silver. (Silver is undervalued).
When GSR is < 50: Sell Silver, Buy Gold. (Gold is undervalued).
Current Status: At 62, the market is currently in "Neutral." Most analysts recommend holding current positions until the ratio tests the 50-level again.
2. Pairs Trading & Rebalancing
Institutional traders use Pairs Trading to profit from the ratio's movement regardless of whether the dollar is rising or falling. In 2026, rebalancing a portfolio to a 60% Gold / 40% Silver split has protected investors from the extreme 30% intraday silver volatility seen this week.
3. The "Physical Swap"
For "stackers" (physical metal holders), the GSR is the signal to visit a local dealer. Swapping 1 oz of Gold for 90 oz of Silver in 2024, and then swapping that Silver back for 2 oz of Gold when the ratio hit 45 this month, effectively doubled an investor's gold holdings for free.
Gold vs. Silver: Key Differences in 2026
Both gold and silver are precious metals and are commonly used as hedges against inflation and economic uncertainty. However, they differ significantly in usage, price volatility, performance, and investment strategy.
| Feature | Gold (XAU) | Silver (XAG) |
| Primary Driver | Central Bank Reserves / De-dollarization | Industrial Demand (AI & Solar) |
| Volatility | Moderate (9% daily max in 2026) | Extreme (30%+ daily swings in 2026) |
| 2026 Outlook | Target $6,000+ (Safe Haven) | Target $150+ (Industrial Squeeze) |
| Scarcity | High (Hard to mine) | Critical (5th year of supply deficit) |
Read the latest news and announcements in this section.
Read the latest tutorials about payment service providers in this section.
You can access full guides and tutorial to use EZDEX services in this section.
Step by step tutorials and photo guides are available in this section.
Access the latest information about financial and economical matters in Turkey in this section.
Explore expert guides, tips, and strategies for understanding and working with gold. Learn everything from basics to advanced knowledge.
Access the latest information about financial and economical matters in UAE in this section.
Expert articles and guides about silver, covering everything from fundamental concepts to advanced insights on investing and understanding the silver market.